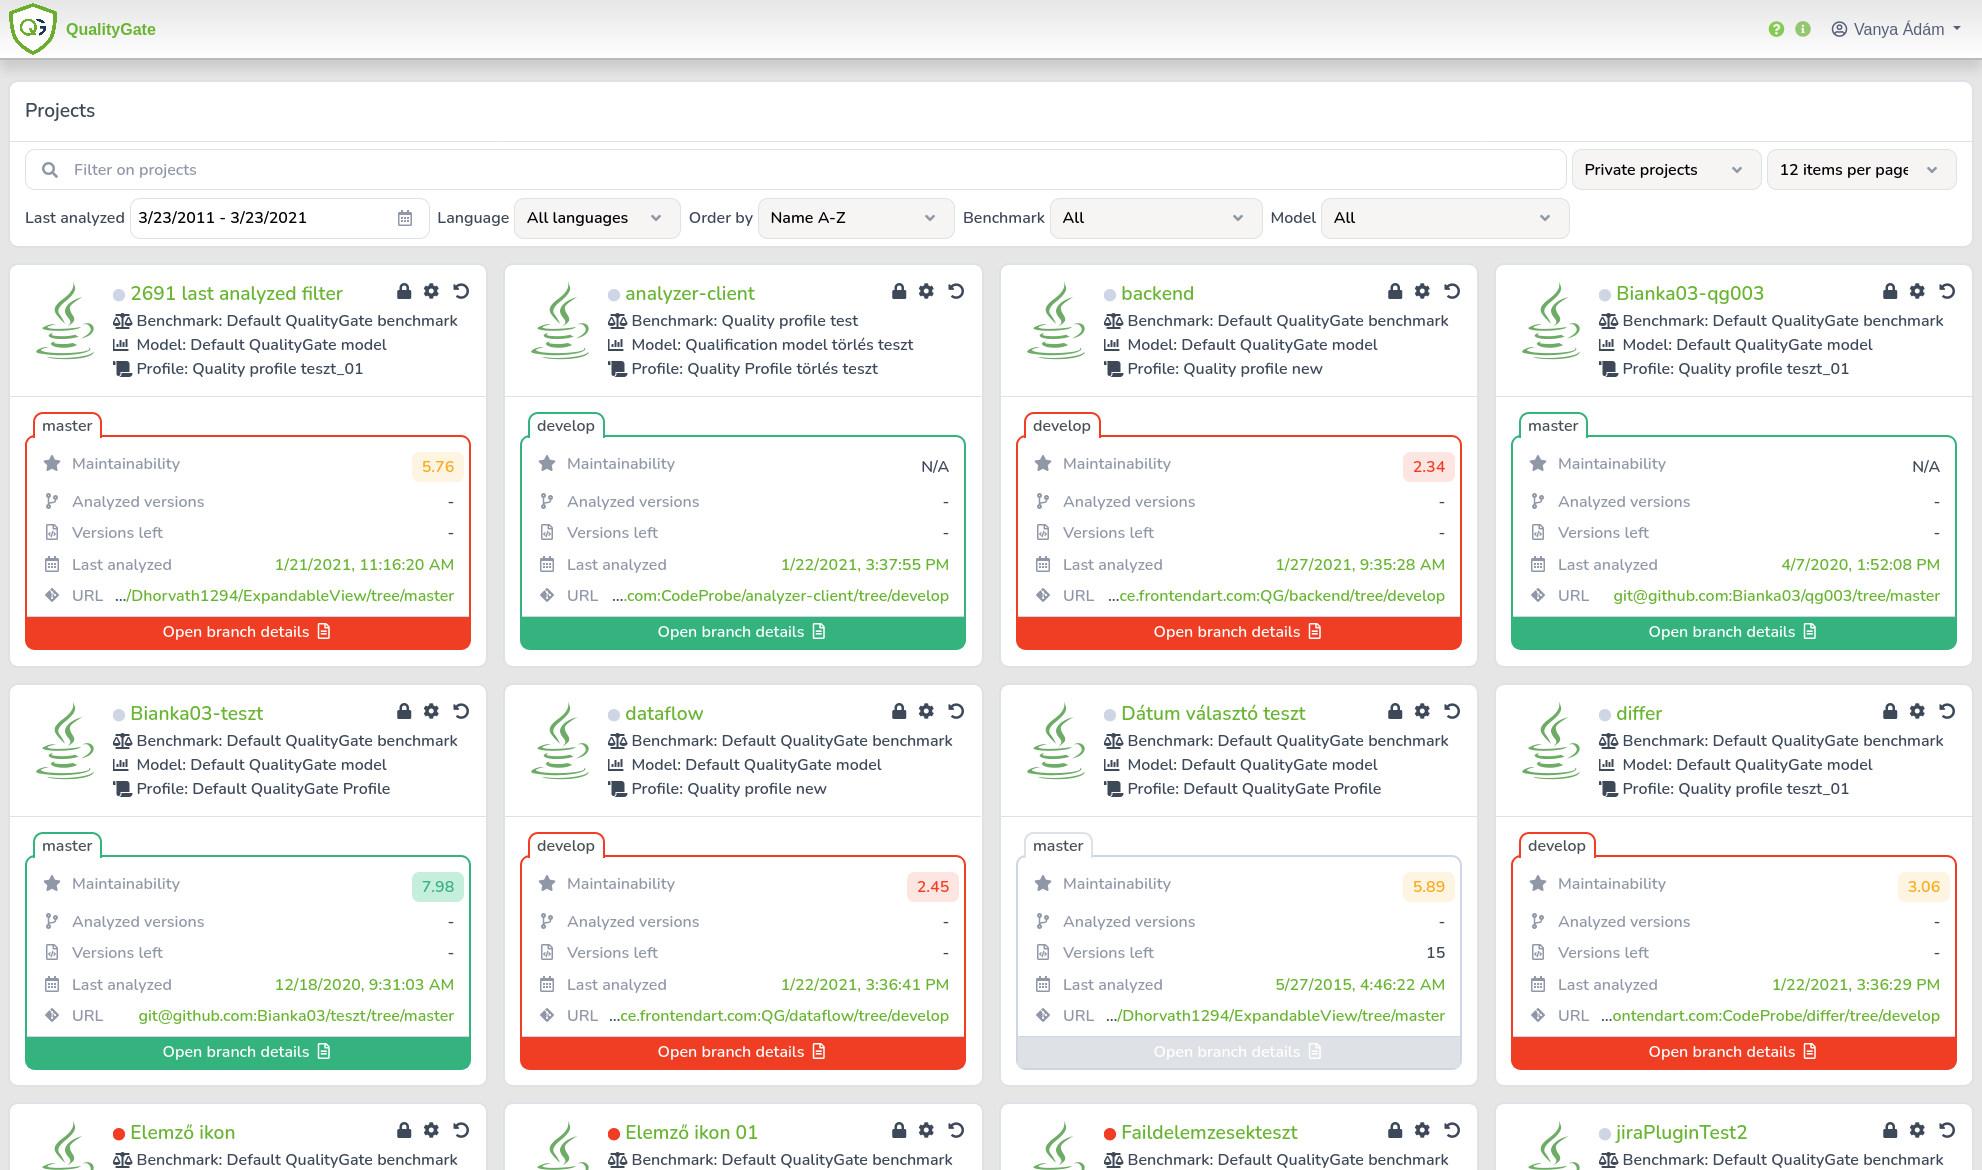
Projects
When entering the Dashboard component of QualityGate, one can see the summary panels for the projects analyzed. Without being logged in, these summary panels are related to open source projects only. After a successful log in, the summary panels for the assigned private projects will become accessible too. Above the summary panels, there is a Projects panel, where one can define search criteria for projects.

Each summary panel presents the name of the project analyzed together with the name of the selected benchmark, measurement model and quality profile. In case of private projects, one can change the benchmark, the measurement model and the quality profile used by clicking on the cog icon in the top-left corner of the summary panel. Left to the cog icon there, is a also a padlock icon for making a private project public or the other way around. Next to the name of each project, there is a colored dot indicating the status of the analyses in the following way: ready, in progress and failed.
With QualityGate it is possible to analyze multiple branches of the same project. The summary panels present further high-level information about these branches in colored tabs. The colors of the tabs can be green or red to indicate whether the implementation fulfills all the criteria of the active quality profile or not. When a tab is colored gray, it means that the quality of the implementation is not measured yet.
For each branch, the following information is provided within a tab:
By clicking on the curved arrow in the top-right corner of the summary panel, one can get to a diagram showing the quality attribute scores of the latest versions of all analyzed branches. This is useful for quickly comparing the quality of the implementations in multiple branches for the same project.
Clicking on Open branch details at the bottom of the tabs takes one to the detailed analysis results.
Back: Overview Next: Project details