Qualification
The Qualification tab of the project details view shows three panels about the quality of the implementation.
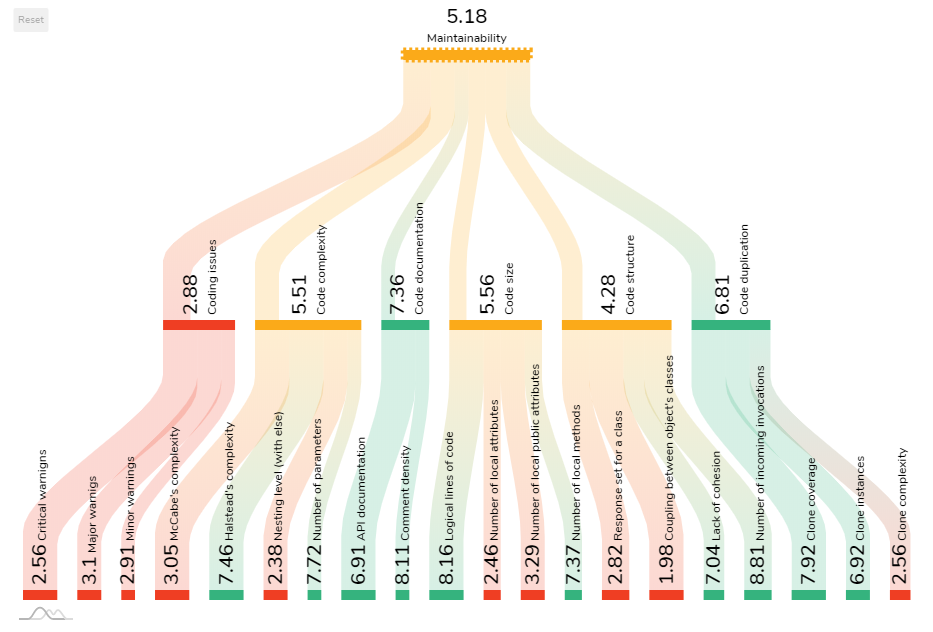
On the left, the panel called Qualification model indicates how the metric-level measurement scores are aggregated to the level of quality attributes. The scores of quality attributes are always calculated based on the scores of the underlying metrics or quality attributes. The metrics and quality attributes are color coded with the colors green, orange and red to provide a quick impression about which of them are above average, average and below average respectively, based on the benchmark used. For private projects, one can define and apply one’s own benchmarks and quality models. The scores presented are related to the last version of the implementation analyzed.
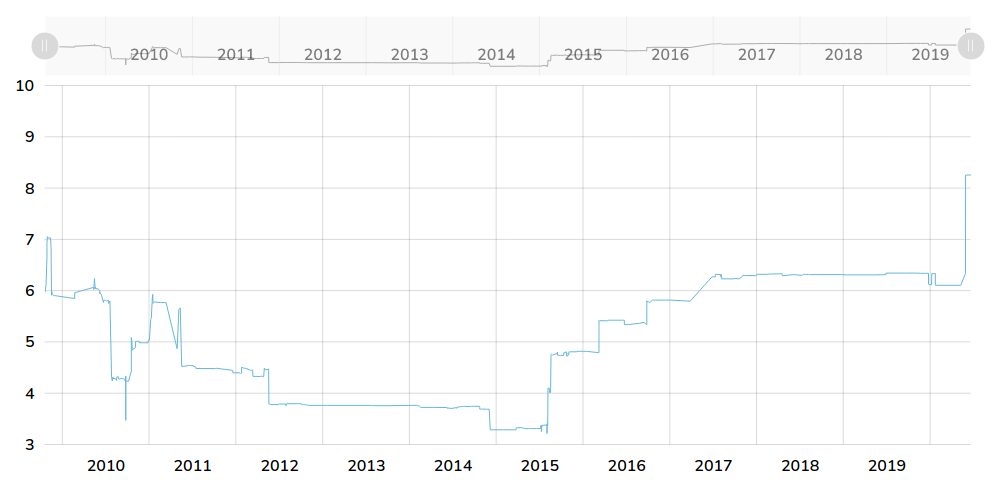
On the right, the panel called Change over time indicates how a the score of a selected metric or quality attribute changed. One can select a metric or a quality attribute to be examined from the Qualification model panel on the left by clicking on a colored bar. The visualized time interval can be adjusted with a sliders.
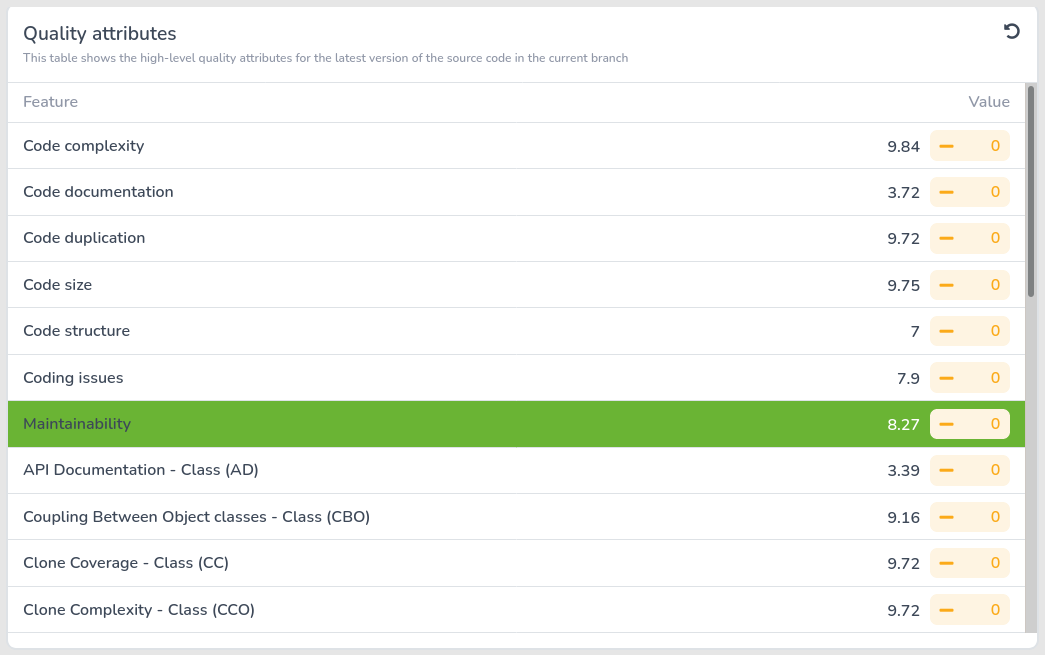
The third panel, called Quality attributes, appears when one clicks on the curved arrow in the top-right corner of the Qualification model panel. Here, one can see all the metrics and quality attributes enumerated and how the last change effected their score.
Back: Project details Next: Metrics